The general public needs to be made aware that COVID-19 does not kill equally. It is not an equal opportunity killer. There are currently public narratives centered around how pre-existing conditions, race, and gender impact COVID-19’s kill rate. I’d like to open the public’s eye about how age impacts COVID-19 deaths. Informing individuals of their specific risk of death from COVID-19 based on their current age will allow them to make informed decisions about their personal safety and movements once our personal freedoms are restored.
The data for this analysis was taken from the Cook County Medical Examiner’s office, using the Cook County Government Open Data Portal. The data dump was of all deaths from natural causes (no accidents, suicides, homicides). Data was examined from the first 15 weeks of each year, for each year 2015 to 2019. These five years of data was constructed to give us a baseline ‘average’ of what normal distributions of deaths look like over this time period, for each 5 year grouping of ages.
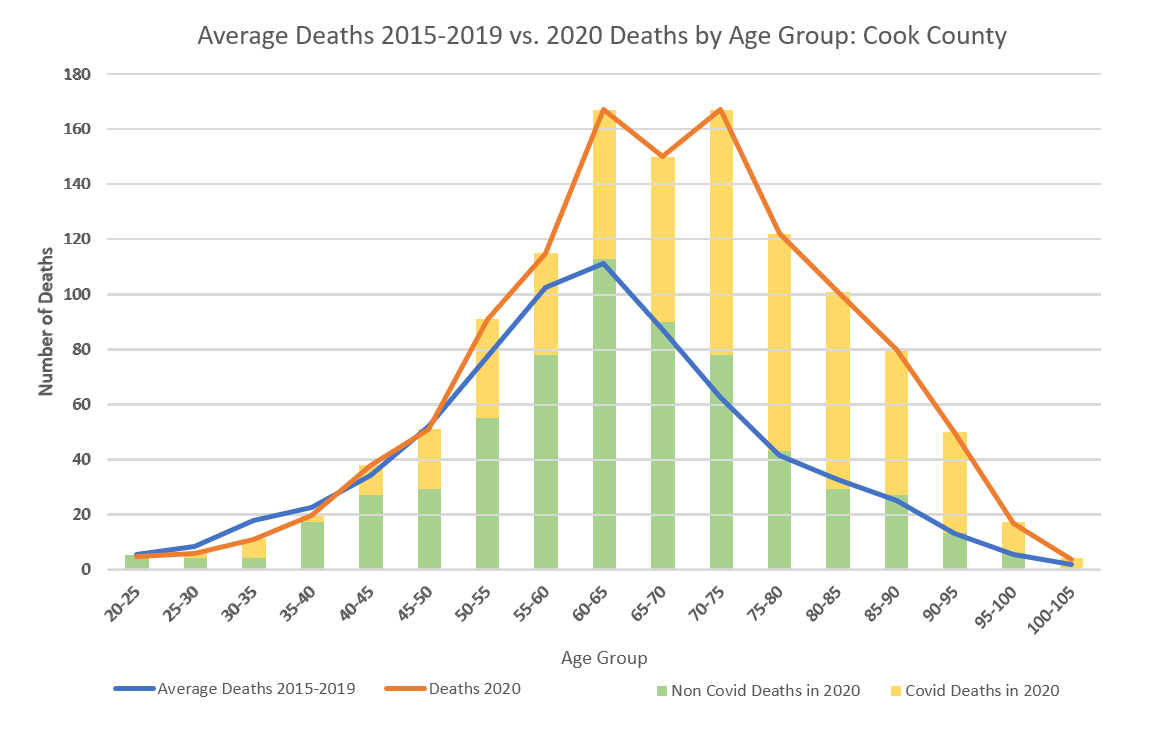
This allows us to look at death counts in context and see how 2020 actually compares to the previous years – not just at a raw death count level, but with further context regarding age. The blue line below is showing us the average death per age group (bucketed into 5 year intervals) per year over this time period.
The orange line shows us total deaths in 2020. On a pure aggregate level, they are much higher. However, if we dig down into the age distribution, we can see that not all age groups have seen their death counts increased, or been impacted.
The average deaths for individuals up to the age of 50 is nearly identical in 2020 as it was for our 5 year previous average. We can use statistics – specifically, 95% (two standard deviations) and 99.7% (three standard deviations) confidence intervals – to show ranges of expected deaths. Our hypothesis here is that the same number of people are dying in 2020 across age groups as in the previous 5 years.
We can start by segmenting the COVID 19 deaths – which we’re defining as any death certificate that lists COVID-19/CoronaVirus as the primary or second cause of death- from the non-COVID-19 deaths. The non-COVID-19 deaths are listed in green on the chart below, the COVID-19 deaths are in yellow.
If we remove the COVID-19 deaths from the 2020 data – remember, COVID-19 didn’t exist last year, so these people would be alive in 2020 if not for the virus – we see that we actually have too few deaths in 2020 for the expected deaths for certain age ranges. We see that these numbers are actually too low – that we have a statistically significant deviation in 2020 from our 2015-2019 data. If we accept the COVID-19 deaths as legitimate deaths by COVID-19, then we can reject our null hypothesis that 2020’s death for these age groups are in line with history.
We can say that ‘2020 is different, not enough people have died in the age brackets of 25-30, 30-35, 45-50, and 55-60 for us to consider 2020 a normal year for deaths’. This is using a 95% confidence interval for 25-30, 30-35, 45-50, and 50-55.
The data leads one to the conclusion that we are inflating our COVID-19 death totals for these age ranges, and not painting an accurate picture of the truth to the public. You can visually see this on the chart below by looking at the total deaths from COVID-19 (yellow bars) plus other causes (green bars). When summed, these are right in line with the expected 95% confidence intervals. Note that the 2020 death counts are in line with the 2015-2019 yearly averages for this time period when we treat all deaths as non-COVID. This shows that we are overclassfiying COVID-19 deaths in younger people.
It would be very easy to be ‘lazy’ here, and extrapolate this narrative to the older age ranges and assume we are also overcounting/misclassifying COVID-19 deaths in the elderly. Let’s examine this widely used media narrative that we are simply mislabeling the Flu as COVID-19, and that there are not any real ‘new’ deaths in 2020. Take another look at the the visual from earlier and focus on the age groups of 60-65+ and over:
You’ll see that the green bars represent the number of non-COVID-10 deaths in 2020 – and that it is right in line with our previous yearly average for each age range at or above 60-65. These counts fall within our 95% confidence intervals, when comparing non-covid deaths in 2020 to all deaths in 2015-2019. This is pretty easy to see on the chart above.
The spike in COVID-19 deaths appears to be simple additional deaths we couldn’t expect from the previous years data. If we set our null hypothesis to ‘2020 deaths are just like previous years deaths, when holding age constant’ we can reject these at a 99.7% confidence interval (three standard deviations) for age brackets from 60-65 to 90-95 and a 95% confidence interval (two standard deviations) for the age 100-105 group (we had 4 deaths in 2020, reasonable to expect up to 5 for 100-105).
This means that the death totals for 2020 are not consistent with 2015-2019, and that something has changed. Visually, these new additional deaths appear to just be the new COVID-19 deaths, which are marked in the yellow shaded bars above.
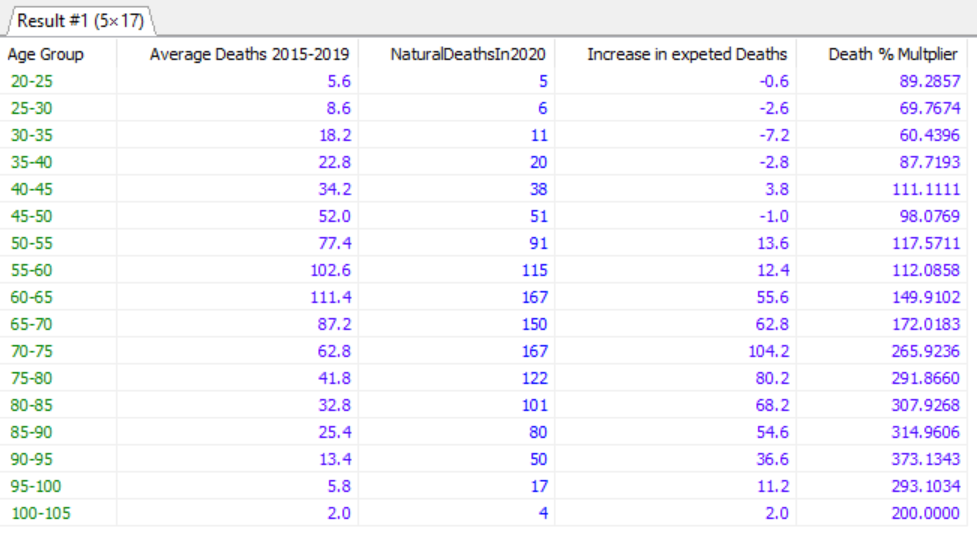
Here is a breakdown of the change in expected deaths from past years to this year, as well as how much the death toll increased over the expected rate. In total, we have observed 491 more than the amount of expected deaths in Cook County during 2020; 475 of these expected deaths are from the 60-65 and older age ranges.
Looking at aggregated state wide data, rolled up to total the number of cases, hospital beds, and death counts is not how a public health crisis like this should be handled. My fear here is that by generalizing every person as ‘equal’ that we are giving improper care and treatment to the vulnerable age groups of this health crisis. Policy plans that support each age group, with respect to their morbidity levels is a much more effective way of minimizing death rates while returning personal freedoms to americans.
